Back to Overview
2021-07-26 70
Renewables remain on course for growth despite coronavirus BP statistics: demand for coal, gas and oil collapses during pandemic, with wind and solar posting massive gains
7 Min 5 5
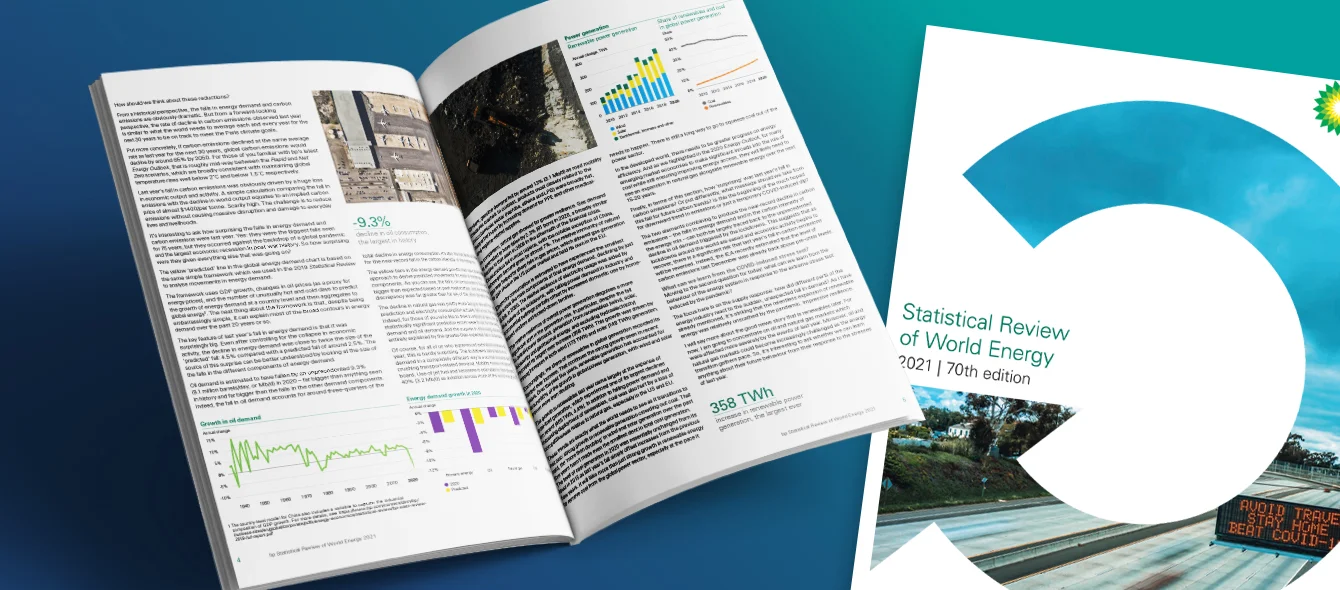
Petroleum giant BP has been publishing annual statistics on worldwide energy supply for 70 years. In the past, the Statistical Review of World Energy has already documented momentous events in the sector, from the Suez crisis of 1956 and the oil price shock at the beginning of the 1970s to the Fukushima disaster in 2011. However, the data analysts claim that none of these incidents have had ramifications as far-reaching as those of COVID-19, commenting on the figures for 2020 published in early July. The pandemic caused global primary energy consumption to drop by 4.5 percent – as much as at the end of World War II. Whereas demand for coal, oil and gas collapsed at record speed, solar and wind power posted substantial growth, based not only on the share of these renewable sources of energy in the electricity mix.
Global primary energy consumption
in exajoules, source: BP Statistical Review of World Energy 2021The report splits 2020 data for the energy sector into two categories. Clearly on the losing side are fossil fuels – particularly oil – which recorded consumption of 9.1 million barrels per day (BPD), representing a 9.3 percent decline to the lowest level since 2011. The steepest drops were registered by the USA (-2.3 million BPD) and the EU (-1.5 million BPD), with China reporting the only rise of a marginal 220,000 BPD. Owing to poor demand, oil saw its price plummet to the level of 2004. Production decreased by 6.6 million BPD, partially due to lockdown measures. By consequence, refinery capacity utilisation was a mere 74.1 percent – hitting its low point since 1985. Coal usage also dropped considerably in the wake of the pandemic, slipping by 4.2 percent, or 6.2 exajoules (EJ). This was mostly on account of the USA and India, which experienced declines of 2.1 and 1.1 EJ, respectively. Consumption in OECD countries recorded the lowest level since data collection started in 1965, with production shrinking by a whopping 5.2 percent.
Energy investment is rebounding, but needs to rise faster Read more
The gas sector displayed more disparate trends. Consumption slipped by a total of 2.3 percent, and demand declined significantly above all in Russia and the USA. By contrast, it rose in other countries including China and Iran. Nevertheless, aggregate trading contracted by 5.3 percent, accompanied by a collapse in price, down to the 1995 level in the USA and the lowest figure ever recorded in Asia. Despite these developments, the share of the energy mix accounted for by gas increased to just under 25 percent. This record was achieved in part because oil usage dropped more considerably than total energy consumption. The resulting deficit was offset by gas and other sources of energy.
Primary energy consumption by energy source
in exajoules, source: BP Statistical Review of World Energy 2021According to the report, the clear winners of the tumultuous year behind us are renewables: it has the portion of primary energy consumption commanded by renewable energy (including biofuel, but excluding hydropower) rising to 9.7 percent. This is slightly below the ten-year average (13.4 percent growth). Based on the 2.9 EJ in absolute energy volume, however, the figure registered was similar to those of the preceding years. In terms of generation, the analysts actually identified a gain of 12.5 percent. The main driver was the huge jump in solar power production of over 20 percent. Photovoltaics were among the frontrunners also with regard to the expansion of renewable energy. Despite the global crisis, solar systems with a total capacity of 127 gigawatts (GW were installed. This also represents more than 20 percent year-on-year growth. Wind energy capacity was up by 111 GW, or 17.5 percent. These developments culminated in 2.1 gigatonnes in CO2 savings. Carbon dioxide emissions were 6.3 percent down on the level achieved in 2019.
Trends observed in the electricity sector include the 0.9 percent year-on-year decline in generation in 2020. This is the steepest drop since when data collection started in 1985 and only the second time BP economists have measured a negative figure. Moreover, the energy mix turned greener here as well: oil, coal and gas provided much less energy, offset by gains in wind and solar power.
Power production by energy source
in terawatt hours, source: BP Statistical Review of World Energy 2021Natural resources tell two tales
Besides presenting an overview of power production and consumption, the report also dedicates a chapter to select developments on the market for natural resources. After all, lithium, cobalt, graphite and rare earth metals are among the main commodities required to run renewable energy systems. And the effects of the COVID-19 pandemic were tangible here as well. Lithium mining, which had increased by an average of 16.3 percent in the preceding decade, recorded a drop of 4.6 percent, with graphite extraction declining by almost 20 percent. On the flip side, nearly three percent more cobalt and 23.3 percent more rare earth metals were mined. This was primarily due to the expansion of cobalt extraction in the Democratic Republic of Congo and the strong growth of the Australian and US markets for rare earth metals.
Energy transition to boost demand for key minerals Read more
Download the full report here: Read more
IEA sets challenging pathway to net zero Read more
More about Energy transition Energy industry Power generation