Author: Dr. Hans Wilhelm Schiffer
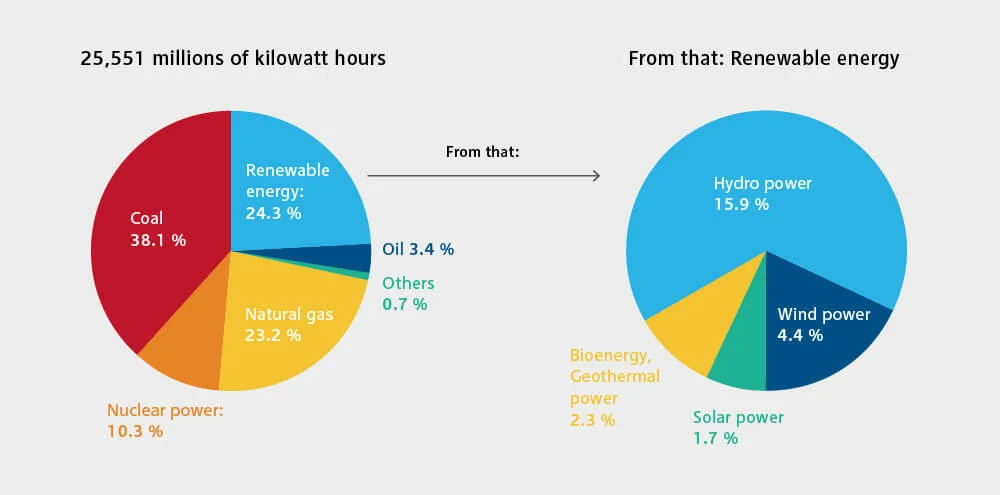
The transformation of energy supplies is a global phenomenon, as demonstrated by the accelerated growth of the expansion of renewable energy. The share of renewables rose from 17.7% in 2007 to 24.3% in 2017. The highest contribution of renewables to electricity generation can be found in Central and South America. Africa, the continent with the lowest electrification rate, also has the smallest contribution from renewables. In terms of worldwide wind power capacity, Germany is in third place, fourth in solar and fifth in bioenergy. Article by Hans-Wilhelm Schiffer from ‘et – Questions of the Day in the Energy Industry’ (german only).
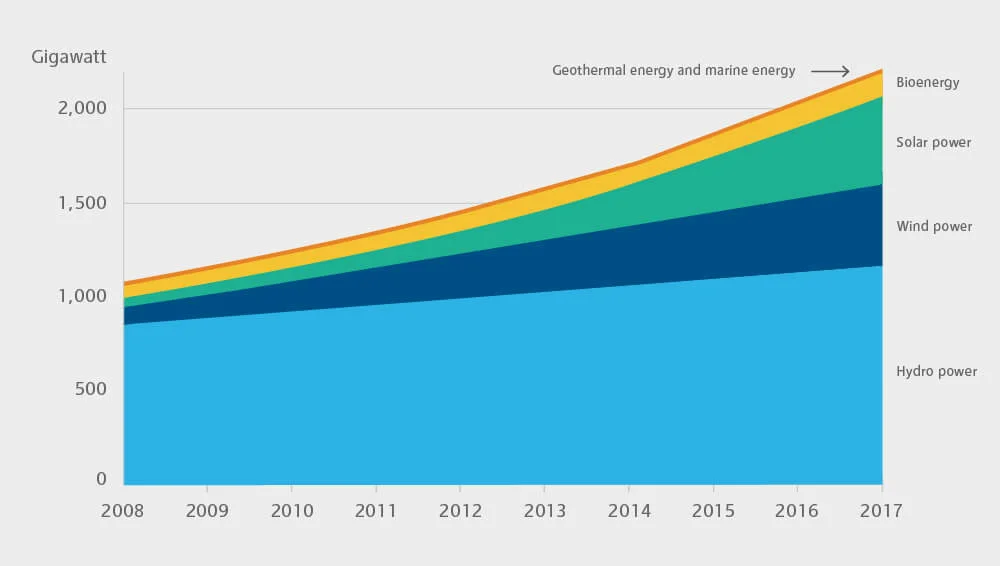
Two-thousand and seventeen was another record year for the worldwide expansion of renewable energy for electricity generation. Power production capacity using hydroelectric, wind, solar, bioenergy, geothermal and ocean technologies increased by 167 Gigawatts (GW) between the end of 2016 and the end of 2017. At 2,179 GW by the end of 2017, generation capacity more than doubled compared to the end of 2008, with an average annual growth rate of 8.4%.
The accelerated growth has been particularly remarkable, as evidenced by the development of the amount of electricity generated from renewables. From 1997 to 2007, power production using hydroelectric, wind, solar, bioenergy plus ocean and geothermal technologies advanced by 30% the world over. The increase in the decade between 2007 and 2017 amounted to 75%. The 5.7% average annual growth in the last ten years was thus more than double the rate in the previous decade, when the amount of electricity generated from renewables rose by an average 2.6% per annum.
Increase in the Performance of Electricity Generating Assets by Technology
The greatest capacity increases worldwide between the end of 2008 and the end of 2017 were achieved in wind (399.1 GW), solar (375.5 GW) and hydroelectric (287.5 GW) power – followed by bioenergy (55.4 GW), geothermal (3,4 GW) and ocean energy (0.3 GW). Whereas growth was stronger in hydroelectric power generation until 2010 than in wind and solar energy, the picture has since shifted in favour of wind and, in 2017, solar energy in particular. Compared with the figure at the end of 2008, wind turbine capacity more than quadrupled and stood at 514 GW by the end of 2017. Global power production from PV assets totalled 391 GW, which is as much as 26 times more than at the end of 2008. Hydroelectric station production (excluding pumped storage plants) rose by a third to 1,152 GW during the same period. Bioenergy capacity has doubled to 109 GW. Geothermal has advanced by 36% to 13 GW. Ocean energy capacity has also doubled, although it only accounted for 0.5 GW of global capacity at the end of 2017.
Capacity Development by Country and World Region
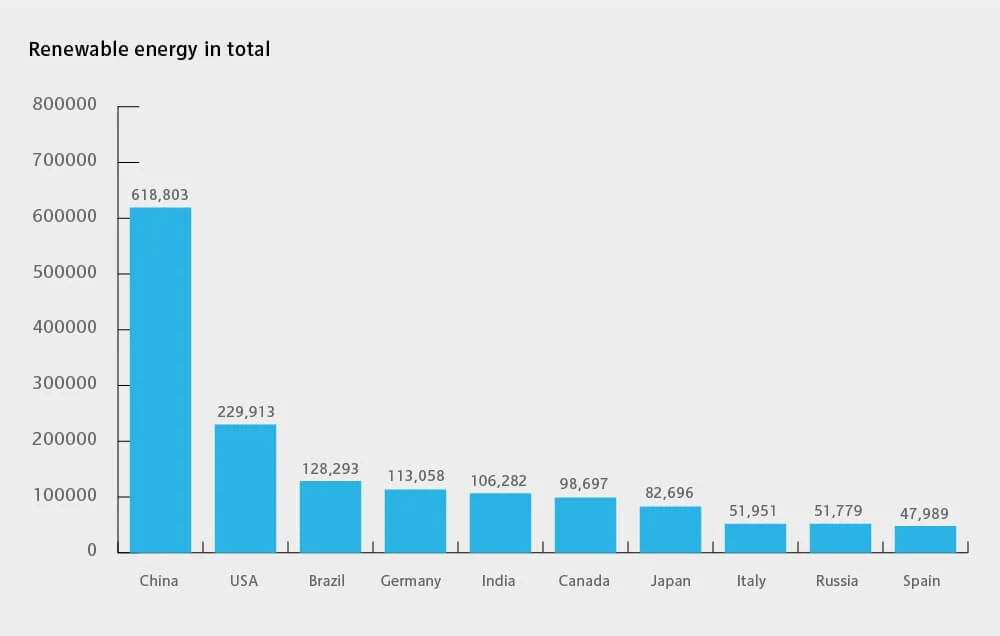
China is not only the country with the world’s highest energy and coal consumption, but also the nation that dominates in terms of green electricity production capacity. At the end of 2017, 28.4% of global electricity generation capacity from renewables was installed in China. The USA ranks second, Brazil third. At 113 GW, Germany is fourth in the international capacity ranking.
Even broken down by renewable energy technology, China leads the table in hydroelectric, wind and solar energy. Other countries only occupy first place in bioenergy and geothermal.
Brazil, the USA, Canada, Russia, India, Norway, Japan, Turkey and France occupy second to tenth spot in hydroelectric power. With its 6 GW of capacity, Germany is not among the world’s 20 leading hydroelectric nations.
The situation differs especially in the field of wind and solar energy. In the wind energy sector, Germany ranks third (as of the end of 2017) after China and the USA; in offshore wind, it is even in second place following the UK and ahead of China. With regard to the worldwide ranking in solar power capacity, Germany is fourth after China, Japan and the USA. It was fifth in bioenergy at the end of 2017 behind Brazil, the USA, China and India. The Top 10 in geothermal energy are the USA, Indonesia, the Philippines, Turkey, New Zealand, Mexico, Italy, Iceland, Kenya and Japan. Germany’s share of global electricity generating capacity from renewables is 5.2% (as of the end of 2017).
Power production capacity from renewable assets has risen sharply in recent years in every region of the world. The greatest dynamism was observed in Central and South East Asia. This applies in particular to the development in 2017. Accordingly, electricity generation capacity from renewables in China rose by around 78 GW between the end of 2016 and the end of 2017. This accounts for 47% of worldwide capacity growth last year. India’s 16 GW in 2017 was the second-largest capacity increase in power production from renewables. In both countries, the growth in solar capacity made up the largest share. The third-largest capacity increase of just under 15 GW took place in the USA. Electricity generated from renewables in Germany rose by just over 8 GW in 2017. This puts Germany in fourth place ahead of Japan and Brazil regarding capacity hikes between the end of 2016 and the end of 2017.
From the end of 2008 to the end of 2017, power production capacity from hydroelectric, wind, solar, bio, geothermal and ocean energy tripled in Central and South East Asia. In Europe, installed capacity almost doubled in the same period. In North America, capacity was expanded by two-thirds. The output from plants using renewables in Africa jumped by 80%, albeit from a very low baseline. Capacity growth in the Middle East and Oceania amounted to just under three-fifths. Output in Central and South America increased by 48%, although it differs sharply from most of the other regions of the world because substantial hydroelectric capacity was already installed in that region before 2008. The smallest percentage of expansion in the period from the end of 2008 to the end of 2017, 45%, took place in the Eurasia region. The explanation for this is the increase of only 10% in Russia, representing more than half the electricity generating capacity from renewables of this region.
The result of this development is that Asia has become the leading region for renewables. As of 31December 2017, Central and South East Asia accounted for 42% of total capacity, Europe for 24%, North America for 16%, Central and South America for 10%, Eurasia (Russia, Armenia, Azerbaijan, Georgia and Turkey) for 4%, Africa for 2% and 1% each for Oceania (Australia, New Zealand and the South Seas) and the Middle East.
The greatest untapped renewable potential to date lies in Africa. The entire continent’s installed power production capacity from renewables is a mere 42 GW. Installed wind capacity is only 8% of Germany’s. In the field of solar energy, it is also 8% relative to Germany, even though the natural conditions for wind and solar power mostly favour much higher utilisation of the plants. The figure given for electricity generating capacity from bioenergy is 1 GW, which is 14% of the installed capacity in Germany. The entire continent of Africa has 32 GW in production capacity from hydroelectric stations (excluding pumped storage), equalling Norway’s installed capacity.
Power Generation from Renewables by Country and World Region
Global gross power output from renewables grew by 75% from 3,553 TWh in 2007 to 6,211.4 TWh in 2017. In the same period, total gross electricity production increased by 27.5% to 25,551.3 TWh. This represents a rise in the share of global power production from renewables from 17.7% in 2007 to 24.3% in 2017.
The differences in the percentages shown for capacity and output are explained by differing utilisation of the plants. Bioenergy and geothermal plants achieve much higher annual full-load hours than hydroelectric, wind and solar plants, which are dependent on the availability of the respective input sources. Hydroelectric generation is more productive than wind turbines and, even more markedly, than solar energy.
More than two-thirds of total electricity generated from renewables worldwide in 2017 were accounted for by the ten countries with the highest production from hydroelectric, wind, solar, bio, geothermal and ocean energy. These countries are China (1,627 TWh), the USA (715.4 TWh), Brazil (467.4 TWh), Canada (442.4 TWh), India (232 TWh), Germany (217.7 TWh), Russia (184.4 TWh), Japan (178.1 TWh), Norway (144.4 TWh) and Italy (104.7 TWh).
The weighting of the individual technologies varies from one country to the next. In Brazil, Canada, China, Russia and Norway, the by far largest share of electricity generated from renewables is based on the utilisation of hydroelectric power. In Canada, Russia and Norway, hydroelectric power accounts for 90% or more of total electricity generation from renewables. In the USA, India, Japan and Italy, hydroelectric power is the major source of renewable energy, although the 2017 percentage is lower than in the three previously named countries. The situation is very different in Germany, where wind power is now the major renewable energy source. In 2017, hydroelectric power accounted for only 9% of electricity from renewables.
At some 65.5% in 2017, Central and South America has the highest contribution of electricity from renewables to power generation – especially hydroelectric power, which amounted to 83% of electricity generation from renewables. Countries with particularly high proportions of renewable energy are Brazil, Colombia, Venezuela, Peru, Paraguay, Uruguay, Ecuador and Costa Rica.
In North America, the USA tops the table for electricity generation from renewable sources. Nevertheless, the percentage of electricity production accounted for by renewables is still limited to only about 16%, the same as in Mexico. Natural gas has now overtaken coal in the USA as the principal source of energy since 2016. Natural gas accounted for 32% and coal for 31% of electricity generation in the USA in 2017. The share of nuclear power was 20%, with oil and other energy sources having shares of 1%. In Canada, by contrast, 65% of electricity is generated from renewable input energy, with hydroelectric power leading the way.
In Europe – including Eurasia (Russia, Armenia, Azerbaijan, Georgia and Turkey) – the share of renewable energy sources in power generation in 2017 amounted to 28.4%; in the EU of 28 it was 29.6%. Hydroelectric power is dominant in the Scandinavian countries (Norway, Sweden and Finland), Iceland, Switzerland, Austria, Italy and France, which benefit from generation conditions in the Alps, and also in some Balkan countries such as Croatia and Albania. In the UK, the Netherlands, Belgium, Denmark, Germany, Poland, Spain and Portugal, wind power is now the most important renewable energy source. The strongest expansion of solar energy within Europe has taken place in Germany. The European countries with the next-largest power production from solar energy are Italy, Spain, the UK and France.
The Eurasia region is characterised in particular by the situation in Russia and Turkey. So far, the share of renewables in power generation in Russia has been limited to 16.9%, of which 99% is hydroelectric. In Turkey, where the proportion of renewable energy sources is double that of Russia, hydroelectric power also predominates. In Georgia, water is clearly the major energy source in power generation.
China, India and Japan are the countries in Asia with the highest rate of electricity production from renewables, although the share of renewables in total power output was fairly moderate in 2017 – 15.5% in India, 17.5% in Japan and 24.9% in China. In both China and India, coal is still the predominant source of energy. It has a 67% share in energy generation, nuclear and gas accounts for 4% and 3%, with oil and other fossil fuels plus pumped storage power plants combining for 1%.
Power generation in countries including North Korea, Laos, Myanmar, Nepal and Bhutan primarily stems from hydroelectric stations. In Vietnam, hydroelectric energy accounts for 37.1% of total power generation.
The structure of power production differs strongly between the two largest countries in Oceania, Australia and New Zealand. Whereas in Australia only 15% of power generation comes from renewables, the proportion in New Zealand is 81.3%, most of this being hydroelectric power. In New Zealand, geothermal energy also makes a major contribution to electricity supply.
Africa is the continent with the lowest electrification rate and the lowest amount of electricity production from renewables. Only about half of Africa’s population has access to electricity. Whereas in North Africa, practically everyone has electricity, the electrification rate in Sub-Saharan Africa is only about one-third, which means that about two-thirds of the population do not have access to electricity. The number of people without power is particularly high in the Central African nations of Nigeria, Ethiopia, Congo, Tanzania, Kenya, Uganda, Sudan and Madagascar. Among the larger countries, the situation is better only in South Africa, although substantial limitations in electricity supplies exist even there. On average, per capita electricity consumption in Africa is only about a tenth of Germany’s.
In Africa, electricity production from renewables totalled 153 TWh in 2017, of which 128,5 TWh was hydroelectric. Africa’s total hydroelectric generation in 2017 was 9% less than that of Norway. In view of the huge natural potential for renewable energy and the low degree of electrification within the continent, it is clear that there is an enormous need to take better advantage of the opportunities offered by harnessing renewable energy for economic development. The reduction in the cost of solar modules and wind turbines marks a great improvement to the conditions for unleashing this potential. Great improvements in the lives of people in Africa can also be achieved by off-grid solutions.
Prospects
A worldwide transformation of energy supply is underway, hitherto focussed on power generation. The acceleration of the expansion of renewable energy is testament to the ongoing transformation.
Meeting electricity demand using renewable energy sources plays a key role in limiting global warming. The replacement of fossil fuels, especially natural gas and oil, in the heating and transport markets by electricity generated from renewables can help to reduce carbon dioxide emissions in these sectors as well. To support this development, existing framework conditions will need to be adapted so that the use of electricity for the increasing coupling of sectors will be sufficiently attractive in economic terms. Nevertheless, conventional energy sources will continue to play an important part in many areas for decades to come. As well as expanding renewable energy sources, therefore, it is essential to continue increasing energy efficiency and making progress in carbon capture and storage technology as well as in CO2.utilisation techniques.
Author: Dr. Hans Wilhelm Schiffer, Executive Chair World Energy Resources, World Energy Council, London, and chairman of the working group ‘Energie für Deutschland‘ of the ‘Weltenergierat‘ – Germany, Berlin
Photo credits: Following ‘Bilanz des weltweiten Ausbaus der erneuerbaren Energien in der Stromerzeugung‘ from ‘et – Energiewirtschaftliche Tagesfragen‘; reisegraf.ch, shutterstock.com


