Back to Overview
2022-10-11 3579
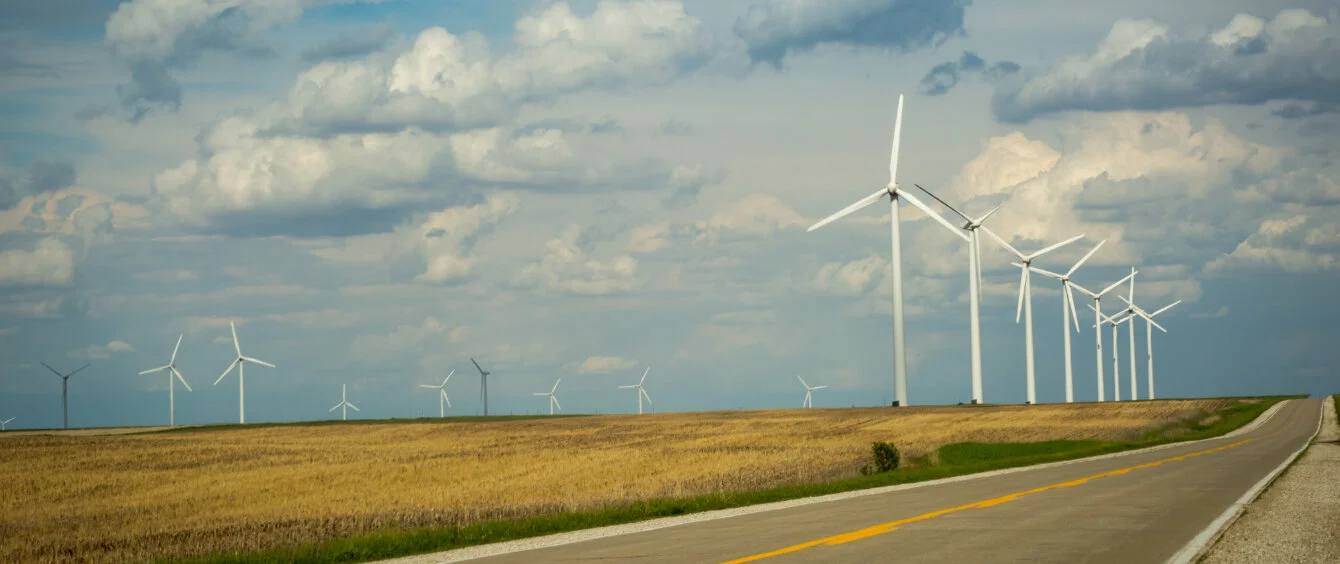
US onshore wind surges ahead Wind farms accounted for 32% of new US power capacity in 2021
5 Min 1 1
While the US offshore wind sector has struggled to gain traction and is only now on the cusp of major expansion, the same cannot be said of onshore wind. Last year, the US added 13.4 GW of new wind capacity, more in a year than some countries have in total power generation capacity from all energy sources.
The new additions brought total US wind capacity at the end of 2021 close to 136 GW, according to the US Department of Energy’s (DoE) latest Land-Based Wind Market Report.
New wind capacity represented 32% of all new generation completed in 2021, second only to another renewable energy source – solar power, which accounted for 45% of new capacity. With renewable energy dominating new capacity additions, there can be little doubt that the US power generation system is becoming greener.
Solar dominates US newbuild Read more
States demonstrate record levels of wind penetration
The potential for more wind power remains huge. Offshore wind offers a massive new resource, while, as the report points out, the US lags a number of European countries with regard to wind penetration, despite the sector’s overall size. While wind supplied 44% of Denmark’s total electricity generation last year and over 20% in Germany and the UK, it accounted for only 9.1% in the US.
However, 11 US states have moved passed the 20% mark and some have even exceeded Denmark’s performance. Top of the leader board is Iowa with 55% of all in-state electricity generation supplied by wind last year, followed by South Dakota (52%), Kansas (45%) and Oklahoma (41%), according to the DoE data.
Moreover, the pipeline of new projects continues to grow.
A record 247 GW of wind power capacity is in transmission interconnection queues. 151 GW are onshore projects, 77 GW offshore and 19 GW hybrid, which typically couple onshore wind with short-duration battery storage. The report says the number of solar and storage projects queuing for interconnection is growing even faster.
US offshore wind lease sale breaks records Read more
Total project costs steady, headwinds notwithstanding
Despite the sector’s dynamism – US wind-related employment increased to over 120,000 last year – domestic blade manufacturing capacity plummeted by 50%, owing to the closure or idling of three manufacturing facilities. Competitive pressures made imported blades less expensive, leading to a rise in imports, according to the report.
Raw materials costs rose last year, but cost gains continue to come from the deployment of larger turbines. The average size of turbines installed in 2021 was 3 MW, up 9% from 2020 and 319% from 1998-99, while tower heights grew by 2% and 164%, compared with the same periods respectively. As a result, installed project costs held steady at an average $1,500/kW, despite a 5-10% increase in turbine prices.
The national Levelized Cost of Energy (LCOE) for wind on an unsubsidised basis for projects build in 2021 was just $32/MWh, the DOE says, with the lowest costs seen in Texas’s ERCOT system at $28/MWh. The report added that the health, climate and grid value of wind far exceeds its LCOE by almost four times.
Gas price rise highlights renewables’ supply security role Read more
Performance metrics continue to improve
Higher towers and larger wind sweep areas help open up prospects with lower average wind speed to cost-effective development, the report finds. New sites in 2021 had average wind speeds of 8.0 m/s, the lowest average of the last eight years. The DoE expects these trends – larger turbines and the tapping of lower wind speeds – to continue in coming years.
Improved performance can also be seen from the capacity factors achieved. The average capacity factor in 2021 was 35% on a fleet-wide basis, but 39% among wind farms built between 2014 and 2020, compared with 26% for projects completed between 2004 and 2011. The ability to harness lower wind speeds has been a major contributor behind increased capacity factors.
Onshore wind and solar remain the cheapest forms of power generation in the US and this, along with the federal Production Tax Credit (PTC), is driving the sector forward.
The report said recent legislative proposals for the long-term extension of the PTC and other national policies could provide upside potential to exceed its current forecasts. Passage of the Inflation Reduction Act in August appears to have done exactly that, so there should be much more to come from the US wind sector.
Watershed moment for the US energy transition Read more
Crisis and transition – World Energy Investment Report 2022 Read more
More about Energy transition Power generation